[ Etna Home Page | Italian volcanoes map | Main Index | Home Page ]
Etna Decade Volcano, Sicily, Italy
This is the moment when you may finally get an idea of the topography of Etna, the distribution of lava flows between 1971 and 1993 and earlier, and the location of towns and villages around the volcano. Below you will see the first in a series of maps that will get you acquainted with the location of the volcano and its surroundings. You may also visit the web site of the Province of Catania (in Italian language) that has a map of all of its towns and Etna (you may "virtually visit" all towns on the map).
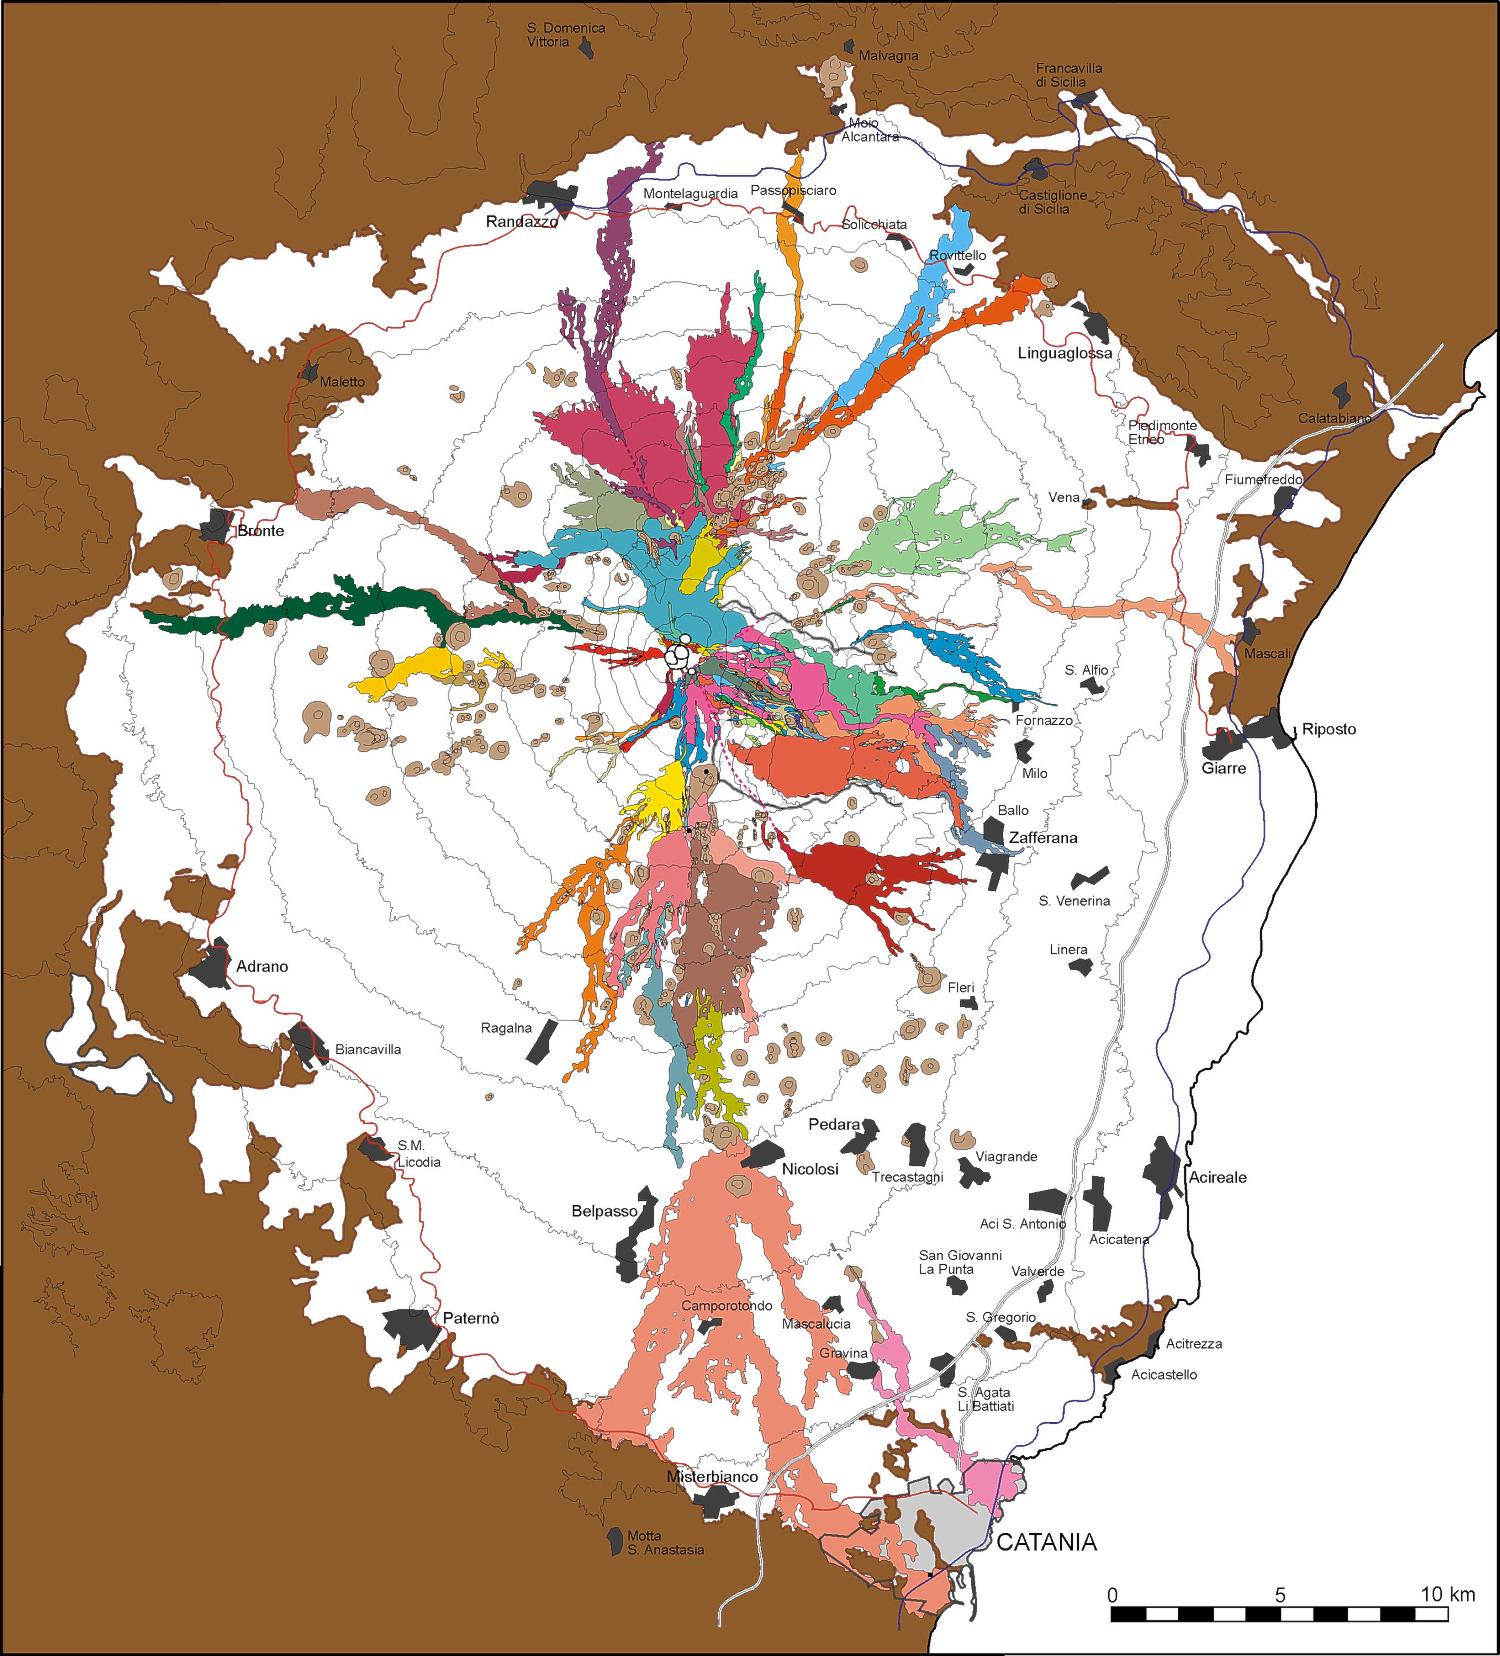
Map showing selected historical lava flows
This map is not the definite map of all historical lava flows of Etna. It shows a selection of lava flows in order to emphasize the location of eruptive vents, the main courses taken by lava flows in the past few centuries, and the hazards related to lava emission on Etna. The oldest flows shown are of 1381 (?), 1614-1624, and 1669. Virtually all lava flows erupted since the beginning of the 18th century are shown where the boundaries and emplacement date are beyond doubt. The full size version of the map shows the entire area covered by Etnean volcanics, towns, railroads and the highway (Messina-Catania). The density of flows especially in the summit area and in Valle del Bove does not allow the eruption dates to be included in this map, but a set of thematic maps (e.g., flows of the 18th century, flows of the 19th century, flows from 1900 until 1971 and 1971 to present) will soon be available and help you recognize the ages of the flow shown here.
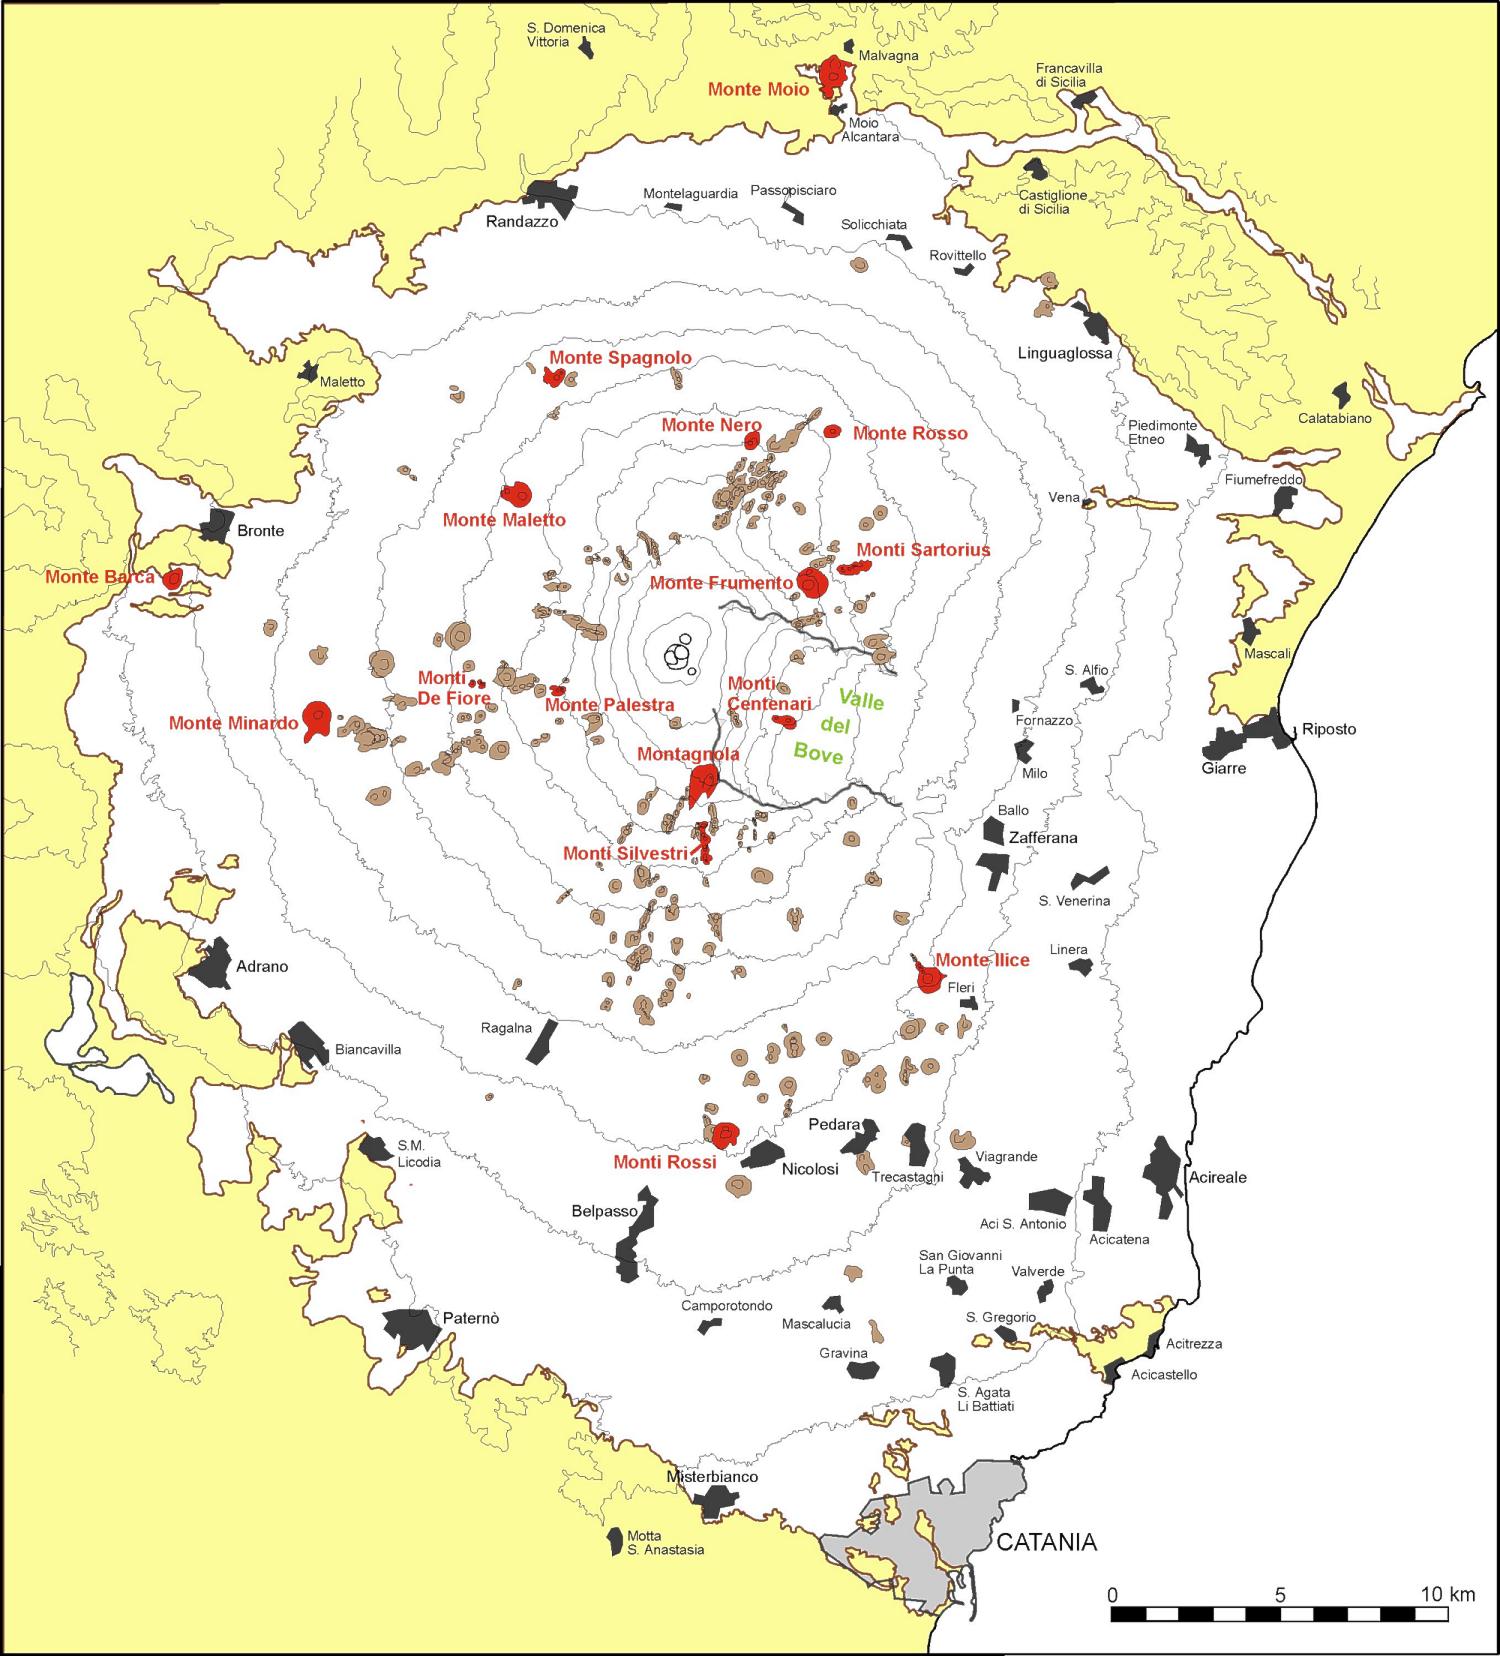
Map showing cinder cones from flank eruptions
This is the first in a set of thematic maps showing particular features of Etna. Here you see the locations of the cinder cones produced by the flank eruptions of the volcano, and some cones to which reference is made more often are highlighted in red color. This map has the same scale as the lava flow map shown above, but the small version shows only the summit area and its immediate surroundings.
ERUPTIONS OF 1381(?) AND 1669 (ATTENTION:
660 k jpg)
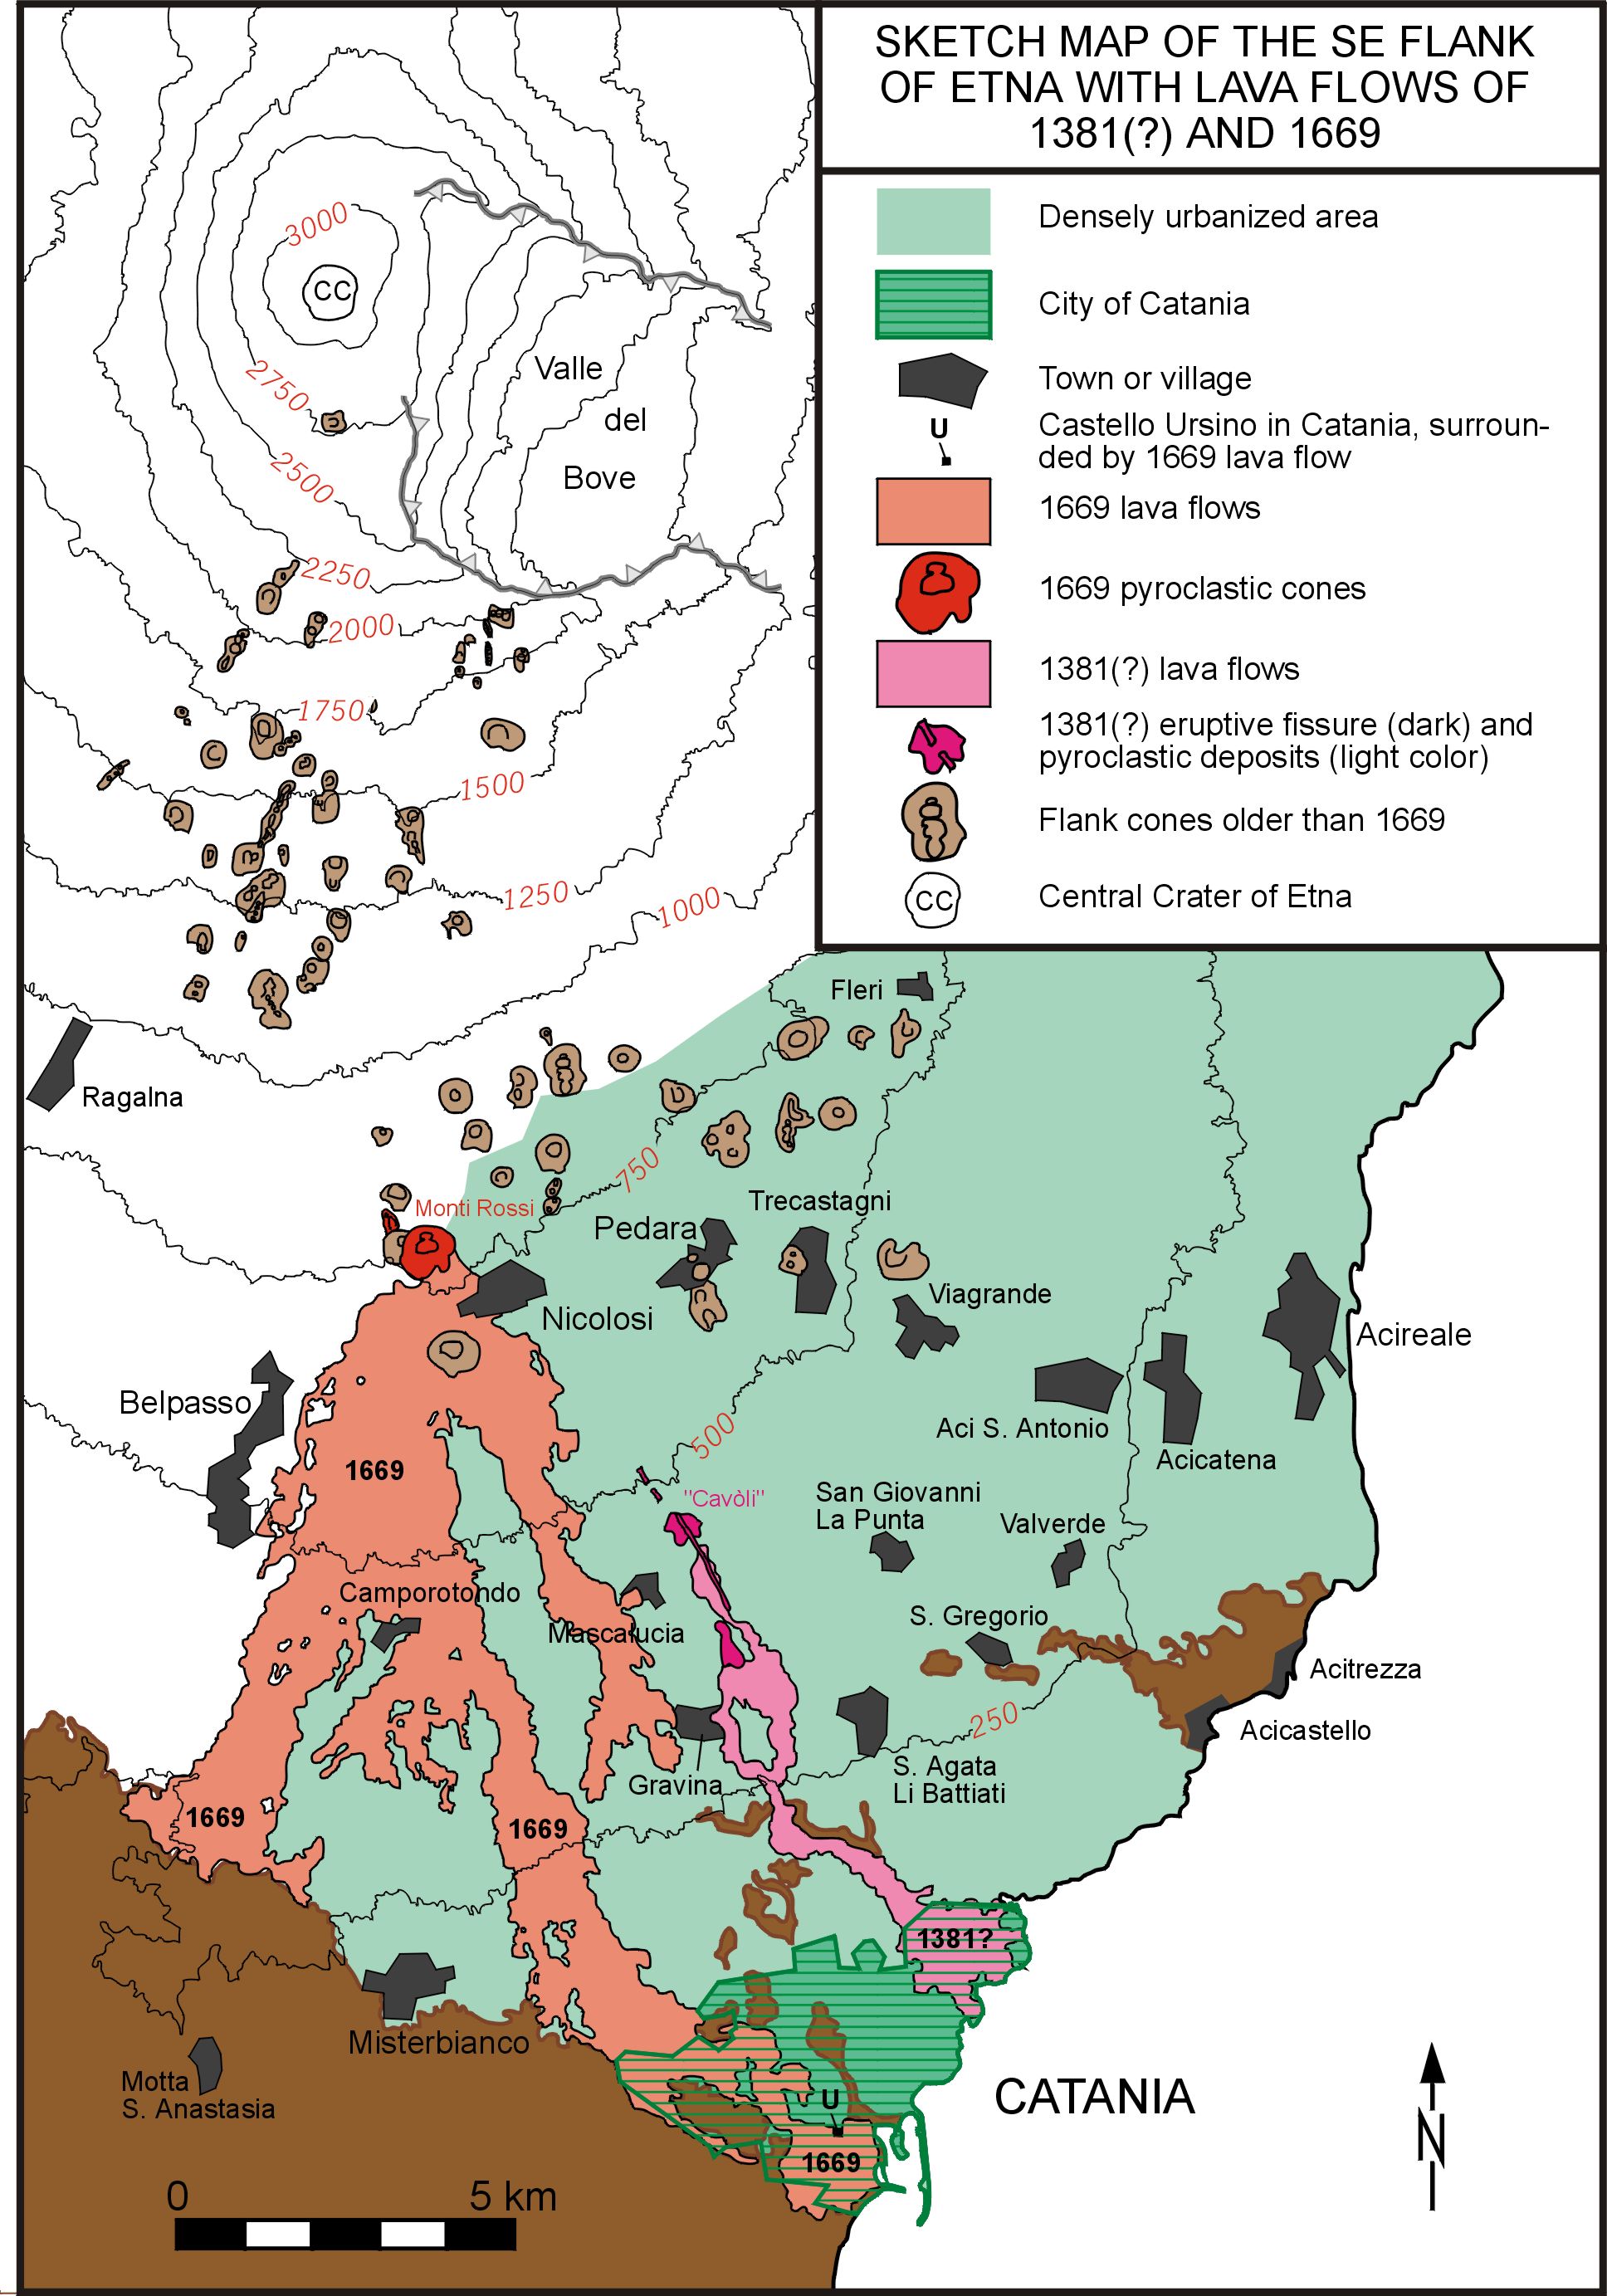
Please note that the brown-colored
patches in the lower left corner and near Catania and Acireale-Acicastello (which
are not labeled in the legend) correspond to the sedimentary basement of Etna.
This map clearly illustrates the hazard from eruptions at low altitude in the
southern and southeastern sectors of Etna. Two clusters of cinder cones and
eruptive fissures can be distinguished: one between about 1100 and 2300 m on
the southern flank, and the other between about 500 and 900 m elevation on the
SSE flank. Note that the cones are larger and tend to be more isolated in the
lower cluster. The largest, and youngest, of these cones is called Monti
Rossi (the plural form of "Monte" has been applied for the
twin peaks on the eastern and western crater rims), it was built during the
eruption of March-July 1669 which ranks among the most voluminous and devastating
Etnean eruptions during historical time. The 1669 lava flows reached a length
of more than 15 km and entered the Ionian Sea south of Catania. It furthermore
surrounded the Castello Ursino, a medieval fortress located on the shoreline
at the southern margin of Catania (note its location, marked with an "U",
with respect to the post-1669 coastline), and a small branch of lava (to the
left of "U" in the map) broke through the city wall on the western
side of Catania. Although it is commonly reported that the city was virtually
buried under the lava, this information is false, and neither were there any
victims. On its path, however, the lava flow which was split into three
main lobes buried sixteen villages and damaged others.
Another historical lava flow is shown on the map, commonly ascribed to an eruption
in 1381 which broke out at only 350-500 m elevation near the town of Mascalucia.
Based on paleomagnetic data, Tanguy (1981) and Tanguy & Kieffer (1993) state
that the flow is about 200 years older (12th century), and the date 1381 is
therefore given with a question mark on the map. The flow from this eruption
miraculously bypassed the major population centers of that era and arrived at
the Ionian Sea to the north of Catania.
Both the 1669 and 1381(?) flows are now in large part covered by the city of
Catania and smaller towns right up to their sources. The eruptive fissure of
the 1381(?) eruption, named "Cavòli", has in recent years been buried
almost beyond recognition by extensive areas of private homes and fruit gardens.
Were an eruption similar to the 1669 and 1381(?) eruptions to occur today, it
would have far more devastating events than those events, because there is practically
no undeveloped space left.
The topography of this map is based on Rasà et al. (1982) while the flow outlines
and locations of cinder cones are after the Geological Map of Mount Etna of
Romano et al. (1979). There are other historical lava flows in the map area,
but they have been omitted for two reasons. 1. Flows younger than 1669 are not
included to highlight the 1669 and 1381(?) lavas. 2. The outlines and ages of
flows older than 1669, except the 1381(?) flow, are poorly constrained. Also,
no cinder cones or fissure vents younger than 1669 are included.
Click on the map to
get a high-resolution version (ATTENTION: 200 k jpg)
Please note that the brown-colored
patches in the right part of the map correspond to the sedimentary basement
of Etna.
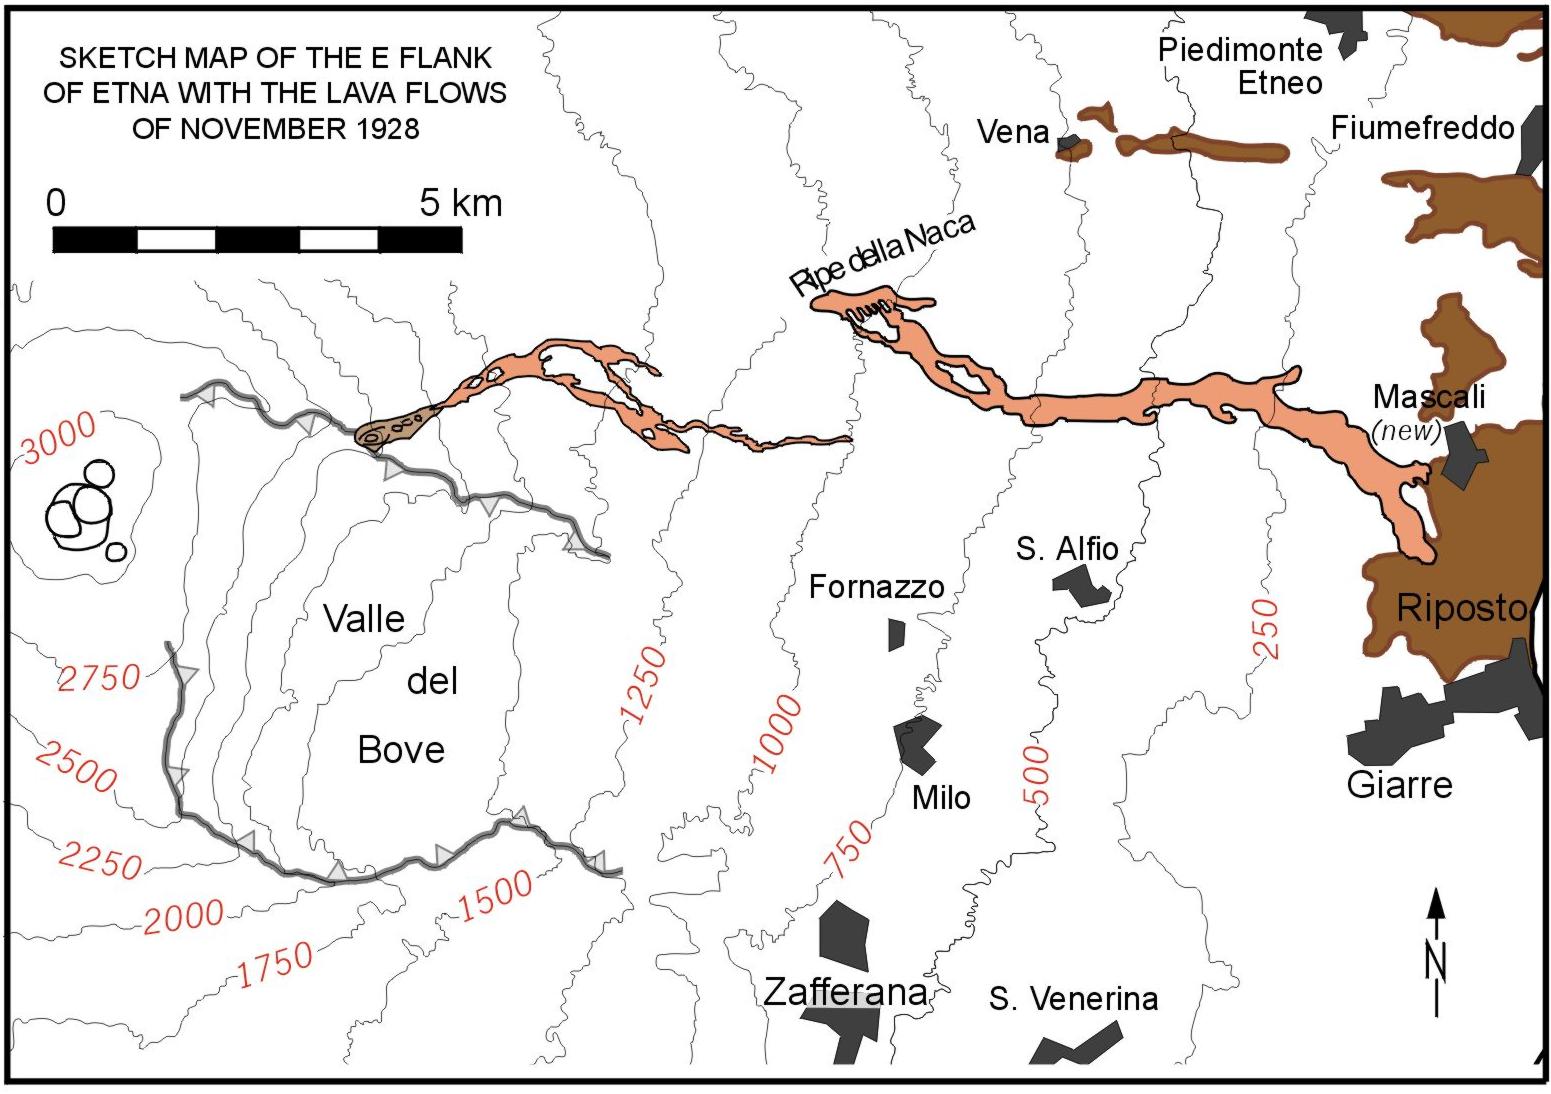
The only Etnean eruption in recent times to destroy an entire village occurred
in November 1928 on the ENE flank. It occurred in a sector rarely affected by
eruptions in historical times and was evidently strongly controlled by regional
tectonics (the main flow erupted from a normal fault that created a morphologic
"step" known as the "Ripe della Naca"). As in other Etnean
eruptions, the 1928 fissures started to open high on the mountain, in the Valle
del Leone - which ist the northwesternmost part of Valle del Bove - and progressively
lengthened downslope across the north rim of the Valle to about 1050 m elevation.
The first sign of the eruption was a series of powerful explosions from NE Crater
on the afternoon of 2 November. Then, three groups of vents formed, one in Valle
del Leone (not shown on the map), the second above the Serra delle Concazze
on the northern rim of Valle del Bove, and the third at the "Ripe della
Naca". The first group produced only small lava flows and became extinct
after few hours while the second group emitted a vigorous lava flow which rapidly
advanced in the direction of the villages Sant'Alfio, Fornazzo and Milo; however,
this latter group ceased its activity on the second day of the eruption. The
third fissure segment produced spectacular lava cascades down the steep slope
of the "Ripe della Naca" which at its base reunited and began a merciless
advance towards Mascali which lay directy in its path. Four days after the beginning
of the eruption the lava began to consume the first houses of the town, and
a few days later, Mascali was erased from the maps, its inhabitants rendered
homeless (like in 1669, there were no victims although some sources say up to
five people were killed), and major roads and railroads were interrupted.
The map shows the extent of the lava flows from the two lower fissure segments
and various towns and other points of reference. Topography and flow outlines
have been drawn after the same sources as the 1669-1381(?) map. Outlines of
the summit craters are as they appear in early 1999; the location of the rebuilt
town of Mascali is indicated.
Click here for more on the 1928 eruption
Maps of lava flow erupted between 1971 and 1993 are available on a separate page. For preliminary maps of the most recently erupted lavas go to the Etna News Page.
Page set up on 12 March 1999