
| Stromboli
home page |
||
| Eruptive history | Volcanic hazards | References |
| Eruptive characteristics | Geophysical monitoring | Web sites |
| Latest news | ||
Geophysical monitoring
of Vesuvio.
A contribution by the Osservatorio Vesuviano
For further information visit the web
site of the Osservatorio Vesuviano
The following was submitted kindly by Francesca Bianco, of the Osservatorio Vesuviano, on 10 March 1996
INTRODUCTIONSomma-Vesuvius is a composite volcanic complex composed of an older stratovolcano (Mt. Somma) and a younger crater (Mt. Vesuvius). The earliest outcropping volcanic deposits date back to about 25,000 years ago. The lavas observed at a -1125 m bore-hole are about 0,3-0,5 million years old.
Mt. Somma is essentially composed
of lava flows with interbedded pyroclastics. Its morphology is the result
of several collapse events which caused the formation of a summit. The
recent activity of Vesuvius has essentially developed inside the rims
of the Somma caldera, although lava flows from sites located outside the
caldera also occurred (e.g. the eruption of 1760).
The eruptive history of the Somma-Vesuvius complex is characterized by
events of different intensity and kind. Three major types of events can
be recognized:
a) small-scale eruptions (10^6-10^7 cubic meters of erupted products).
These events are characterized by effusive or mixed activity (effusive/explosive).
The type eruption is the one which occurred in 1906.
b) moderate-scale eruptions (about 10^8 cubic meters of erupted products,
subplinian). These events are characterized by exclusively explosive activity.
The type eruption is the one which occurred in 1631.
c) large-scale eruptions (10^9 cubic meters of erupted products, Plinian).
The type eruption is the one which occurred in 79 A.D. At least three
of these events (Pompei 79 A.D., Avellino 3360 years b.p. and Mercato
7900 years b.p.) produced calderic collapses.
Moderate to large-scale events are rarer (six plinian events in the last 18,000 years and about ten subplinian eruptions). Beginning with the last subplinian eruption (1631), Vesuvius has characteristically displayed Strombolian activity (with open conduit) and effusive-explosive eruptions alternating with short periods of quiescence. The most recent cycle of activity ended with the 1944 eruption, which marked the beginning of a quiescent period characterized by low activity (intracrateral fumaroles and moderate seismic activity). Vesuvius should be considered as an extremely hazardous active volcano, which, during its long eruptive history, has had many long quiescent periods. The volcano's history suggests that the longer the quiescence period, the more violent the reactivation. Moreover, the intense urbanization of the Vesuvian area (about 700,000 inhabitants) has brought about a very hazardous situation. Therefore, the main purpose of the Osservatorio Vesuviano is to study the behaviour of the volcano, progressively improving and extending the surveillance network.
GEOPHYSICAL SURVEILLANCE
The present activity of Vesuvio is monitored by a complex system of seismic and geodetic networks. The networks aim to monitor in advance possible significant variations in the physical parameters observed. Such variations may be related to increased dynamics of the volcano, which may trigger and/or accompany migration of magma towards the surface and consequent possible eruptions.
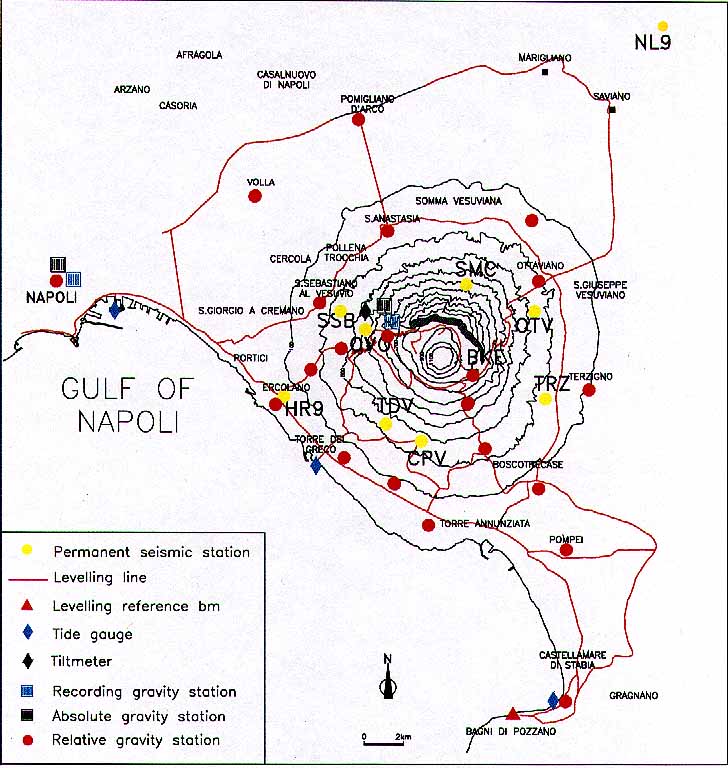
Figure 1: Geophysical monitoring network of Osservatorio Vesuviano on Mt. Vesuvius
Seismic Network
The seismic network consists of 9 vertical-component analogic stations and one station (Osservatorio Vesuviano) with three components located at varying heights on the volcano and on the surrounding plain (Fig. 1). Seismic signals from remote stations are radio-transmitted to the Surveillance Center of the Osservatorio Vesuviano and sampled (100 Hz), the connection to a personal computer allows the continuous acquisition of data. Signals from remote stations operating on the NE side of the volcano are radio-transmitted to Nola (NL9); the signals from the stations located on the SE side, instead, are transmitted to the CPV station (Fig. 1) by means of an integrated phone-radio system. From the sites of data acquisition, seismic signals are then transmitted to the Surveillance Center.
The seismic monitoring system of the Vesuvian area will be completed during the current year (1996) with the installation of a digital network constituted by six Kinemetrics digital stations equipped with three Mark L4C components.
Geodetic Networks
Ground deformation is monitored by one levelling (Fig. 1) and one planimetric (Fig. 2) network. The former consists of 250 benchmarks forming 13 closed circuits for a total length of about 200 km. It extends from Naples as far as the stable limestone of the Sorrento peninsula, to which it is connected, and is developed inland to include the whole volcanic complex. The planimetric network, instead, is restricted to the middle-high area of Vesuvius; it consists of 21 benchmarks, allowing the measurement of about 60 lines. In view of the present activity level of the volcano, levelling and planimetric measurements are performed yearly.
In order to detect possible differential ground movements at Vesuvius and Campi Flegrei, the local geodetic networks have been connected with each other. For levelling networks, the connection of the two contiguous sides of each network has been carried out, and two new circuits have been established. The connection between the planimetric networks of Vesuvius and Campi Fregrei, instead, have involved great logistic difficulty essentially related to the lack of intervisibility between the benchmarks of the classical planimetric networks operating in the two areas. Therefore, with the aim to establish a network controlling the whole wide Vesuvius surface, a GPS network controlling both areas have been operated (Fig.3). It comprises the classical EDM networks already existing, which will continue operating as local networks. For the GPS networks 20 benchmarks have been identified in the Vesuvius area and 12 in the Campi Flegrei.

Figure 2: Planimetric network on Mt. Vesuvius
Three sites (S. Agata sui due Golfi, Osservatorio Vesuviano and Solfatara) have been linked to the Tyrgeonet (Tyrrhenian Geodetic Net). (Fig.3).
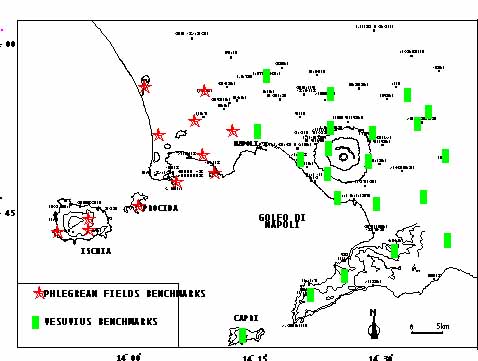
Figure 3: GPS network in the neapolitan area
Tiltmetric Network
Tilt variations are continuously monitored by tiltmeters. At present, a completely automatic tiltmeter station located in the underground gallery of Osservatorio Vesuviano (Fig. 1) is operating, and the data collected are teletransmitted to the Surveillance Center. A two-component transducer mod. 702 from Applied Geomechanics, equipped with a temperature sensor, is used. This network is being extended.
Tide-gauge Network
Analysis of the tide-gauge
data contributes to the study of vertical ground movement in the Vesuvian
area. Tide-gauge stations are located at Torre del Greco, Castellammare
di Stabia and Naples (Fig. 1). The last two are used as reference stations,
and the relative stability is continuosly checked through the analysis
of tide-gauge data, the results of precision levellings and gravimetric
measurements. The Naples station, also used as reference of the tide-gauge
network of Campi Flegrei, is a junction of a European network of tide-gauge
stations aiming to monitor the long-term variations in sea level.
The tide-gauge stations of the Vesuvian network, as well as those of the
Phlegrean network, are connected with one another by means of levelling.
Gravity Network
The gravity network (Fig. 1) was established in 1982, and at present consists of 20 benchmarks. The differences among the benchmarks of the networks are referred to the absolute station of Naples. An absolute gravity station has been established at the Historical Building of the Osservatorio Vesuviano (on the NW flank of the Vesuvian cone), where a gravity recording stations has also been operating since 1987 with the aim to continuously monitor the variations in gravity and tidal parameters. The measurements are carried out using a LaCoste & Romberg mod. D no. 126 gravity meter, equipped with a feedback system.
SEISMIC ACTIVITY OF VESUVIUS
The seismic activity monitored
in the Vesuvian area in 1994 and in the first months of the current year
is consistent with the trend of the last years, characterized by low energetic
levels (Castellano et al., 1987; Berrino et al., 1993; Vilardo et al.,
1995).
Fig. 4 shows the time distribution of the seismic events per month during
the last five years.
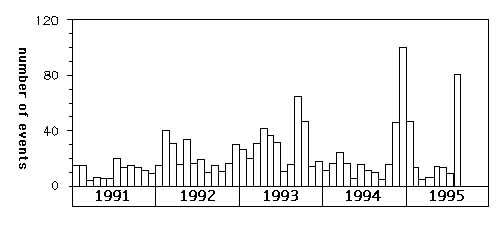
Figure 4: Time distribution (per month) of the seismic events occurred in the vesuvian area in the last 5 years
The distribution of the cumulative
strain release (Fig. 5) shows a regular trend with significant peaks in
energy release in the last months of 1994 and in August 1995. The former
peak was related to a significant increase in the frequency of seismic
events in November-December 1994. In this period 145 low-energy earthquakes
occurred, 18 of them having a magnitude ranging between 2.0 and 2.6. After
this short interval of moderate seismicity, from January to July 1995,
seismicity showed again the usual low levels. In August, a new increase
in strain release was observed in coincidence with the increase in the
frequency of seismic events (82 in August, 7 of which with a magnitude
2.0
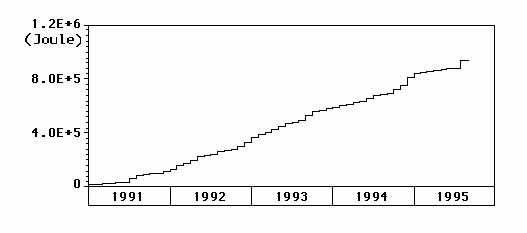
Figure 5: Cumulative distribution of strain release in the vesuvian area in the last 5 years
Over the last five years, up to August of the current year, the magnitudes observed did not exceed the value of 2.8. This value was monitored only for two events, which occurred on November 1992 at 16:18 and 8 August 1993 at 05:57 (local times). An event of magnitude comparable to that of 2 August 1995 was recorded on 19 March 1989 (M=3.2). The localization of the seismic events recorded in 1994 up to now involves an extremely reduced volume. The epicenters appear confined within the crater of the volcano, and the focal depths do not exceed 4 km below sea level.
The spectral characteristics of the seismic events and the relevant focal mechanisms suggest that the source mechanism is due to crust rupture phenomena. Harmonic tremor and monochromatic low-frequency events related to the presence and movement of fluids have never been observed.
GROUND DEFORMATION
The analysis of the vertical ground motion data collected up to 1973 (Bonasia et al., 1974, 1985; Bonasia and Pingue, 1981; Berrino et al., 1993) has shown moderate movements related to local phenomena.
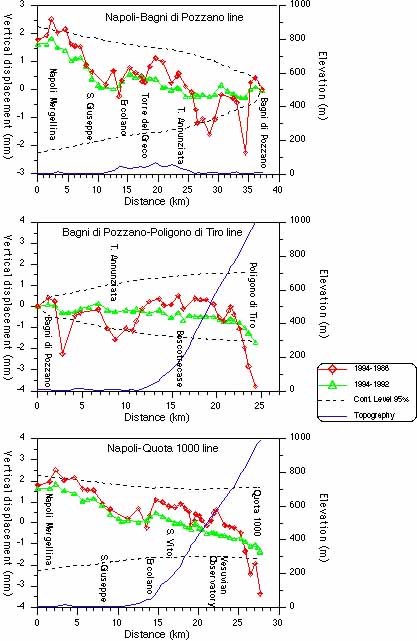
Figure 6: Vertical displacements (1986 - 1994) at the lines: Napoli-Bagni di Pozzano, Bagni di Pozzano-Poligono di tiro and Napoli-Quota 1000
The last measurements were carried out in 1994, and the data obtained were compared with those previously collected. Figure 6 reports the height variations that occurred at the benchmarks located along three main profiles. It is evident that no significant displacement took place in the period 1992-1994; the 1986-1994 cumulative curves show only a trend towards subsidence at very few benchmarks localized on the top of the volcano (800-1000 m a.s.l.) displaying a subsidence velocity of 3-4 mm/year. This behaviour, already pointed out by Bonasia et al. (1985) and Berrino et al. (1993), was confined to an area formed by loose material and characterized by steep slopes. Significant correlations between ground movement and topography are not evident. Therefore, the trend towards subsidence was probably due to local compactation phenomena of the terrains.
A large number of papers have been published on the planimetric variations measured at Vesuvio over the last 15 years (Bonasia and Pingue, 1981; Bonasia et al., 1985; Pingue and Esposito, 1988; Pingue et al., 1988, 1989; Berrino et al., 1993) they have never shown significant horizontal deformations involving the whole volcanic complex. In the area, variations have been systematically monitored only on the lines ending on the calderic rim. The four benchmarks localized on these lines have constantly shown significant local movements, so that it was necessary to carry out reinforcement works several times. Therefore, such benchmarks have been used only in order to overcome the topographic conformation of the volcano which prevents the intervisibility between its two sides. Out of the crater rim, no significant planimetric displacements of the benchmarks have been recorded with respect to the two benchmarks which are considered fixed. These are located on the Mt. Somma structure, which is more stable than Vesuvius.
Distances were last measured in January 1995 utilizing two DME (AGA 142 and Leica DI3000S) of comparable precision. The comparison with the previous data has been made by plotting a graph of the variations in the lengths of the six common lines in various periods as a function of time (Fig. 7). The variations observed are not statistically significant, exhibiting correlation lines that show a variation rate of the order of mm/year.
Fig. 8 reports the trends of the variations in ground tilt and temperature at the OVO tiltmeter station (Fig. 1) in the period March 1993-August 1995, showing an about 40-rad tilt in the WSW direction, associated with a temperature increase of 2.5 C°.
The results of the analysis of the sea-level variations in the Torre del Greco area collected since 1987 show that a very slow subsidence occurs at an average velocity of 0.40.05 cm/year (fig. 9).
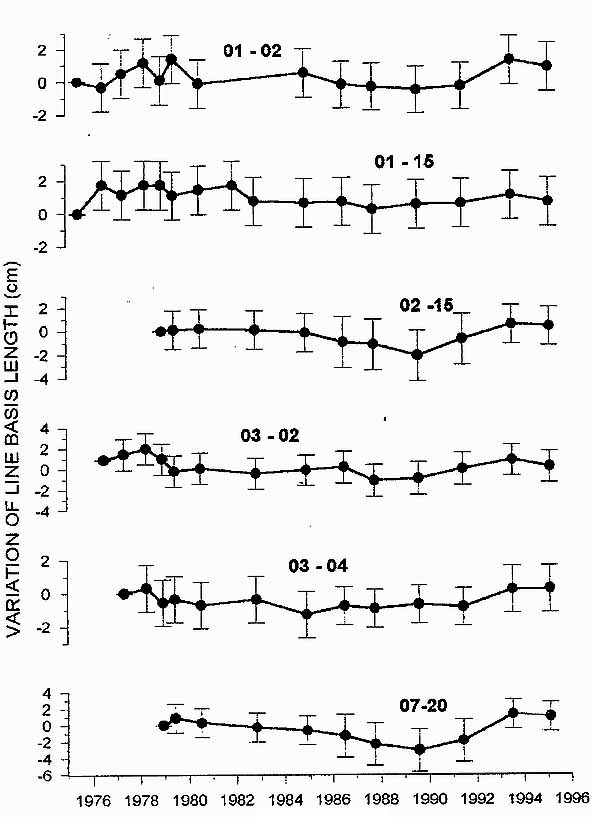
Figure 7: Variation of line basis lenght at 6 base-line in the period 1975-1995. The error bar is relative to a 95% confidence level
GRAVITY FIELD
The areal distribution of the gravity changes is well-defined, considering the period 1982-1994. It is characterized by an area of gravity decrease (about 100 Gal) at the base of the Gran Cono, and an area of gravity increase (about 80 Gal) centered on Torre del Greco.
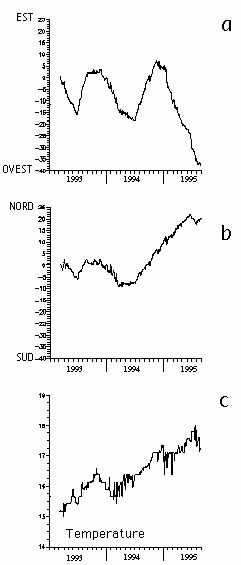
Figure 8: OVO station tilt variations (rad) in the NS (a) and EW (b) directions, and temperature variations (Celsius temperature scale) (c), from March 1993 to August 1995
This distribution shows a
strong NW-SE gradient in coincidence with the area comprising one of the
most important NE-SW structures (Fig. 10a).
In particular, a comparison of 1994 data with those of 1993 (Fig. 10b)
has shown an overall gravity decrease with maximum values ranging betwen
40 and 60 Gal, observed SW and E of the Gran Cono. A significant gravity
increase (over 20 Gal) was instead observed at the Volla station, NW of
the Gran Cono (Fig. 10b).
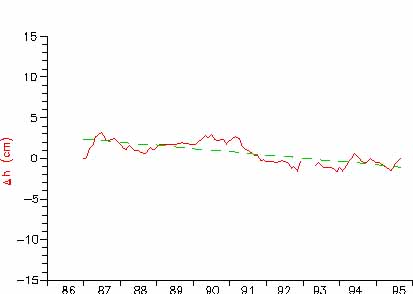
Figure 9: Vertical ground displacement (continuous line) at the Torre del Greco tide-gauge station. The trend (hatched line) shows a progressive subsidence
In May 1994, absolute gravity measurement was carried out. A comparison with the measurement already taken in 1986 shows a gravity decrease of about 60 Gal, confirming the results of the relative measurements carried out in the same period. Absolute results are represented by circles in Figure 11, on the gravity time variation curve, in correspondence with the Vesuvius-Osservatorio Vesuviano station.
In April 1995 a new gravity survey was performed. A comparison of the data with those of 1994 (Fig. 10d) has shown a gravity decrease in the area between Torre del Greco and Boscoreale with a maximum value of 60 Gal centered on Torre del Greco, a g increase with maximum values exceeding 40 Gal confined to E and W of the Gran Cono, and lastly a decrease of about 50 Gal in the Volla area.
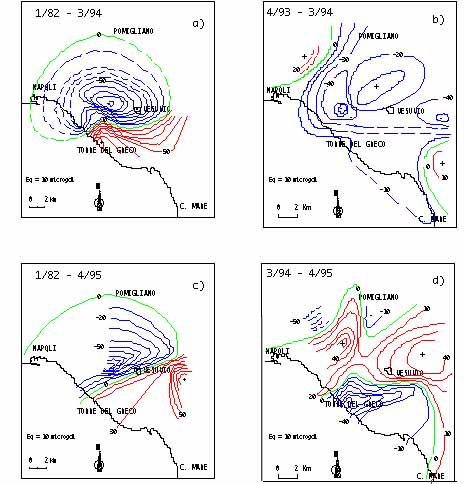
Figure 10: Gravity variations in the periods 1982 - 1994 (a), 1993 - 1994 (b), 1982 - 1995 (c) and 1994 - 1995
The two marked gravity decreases observed at Volla and Torre del Greco have been found at stations which have been characterized by a general gravity increase since 1994 (Fig. 11). In particular, the minimum at Torre del Greco remarkably changes the areal distribution of gravity changes with respect to 1982 (Fig. 10c). The geometry of the gravity changes is always characterized by a decrease area (about 100 Gal) at the base of the Gran Cono and an increase area in the SE slope, with a maximum value of about 80 Gal. However, the maximum value is centered on Terzigno rather then on Torre del Greco (as observed up to 1994). In addition, the increase area appears to be slightly extended towards Ercolano, and the strong NW-SE gradient persists.
The absence of ground movements clearly indicates that time evolution of gravity may be due to a mass redistribution in the subsoil, as, for instance, fluid migration in a porous medium. The low seismic activity and the correlation between field shape and some geological structures suggests that the mass redistribution might occur through pre-existing lineations.

Figure 11: g time variations (1982 -1994) at the gravimetric network. Circles at Vesuvio-Osservatorio station represent the absolute g measure
REFERENCES
Berrino G, Coppa U, De Natale G and Pingue F (1993) Recent geophysical investigation at Somma-Vesuvius volcanic complex. Journal of Volcanology and Geothermal Research 58: 239-262
Bonasia V, Ferri M, Montagna S and Pingue F (1974) Le deformazioni del suolo quale mezzo d'indagine sulla dinamica vulcanica al Vesuvio ed a Vulcano. Rivista Italiana di Geofisica 23, 3/4
Bonasia V, Pingue F (1981) Ground deformations on Mt Vesuvius from 1977 to 1981. Bulletin Volcanologique 44, 3
Bonasia V, Del Pezzo E, Pingue F, Scandone R and Scarpa R (1985) Eruptive history, seismic activity and ground deformations at Mt. Vesuvius, Italy. Annales Geophysicae 3, 3
Castellano M, Vilardo G, Ferrucci F, Gaudiosi G and Luongo G (1987) Ultramicrosismicita' del Vesuvio. Atti VI Convegno GNGTS, CNR, Roma: 247-250.
Pingue F and Esposito T (1988) Misure di livellazione di precisione nell'area vesuviana Bollettino di Geodinamica e Scienze Aff. 47, 3
Pingue F, Martini M and Esposito T (1988) Deformazioni del suolo nell'area vesuviana ed analisi della sismicita' a Stromboli Bollettino GNV for 1988, CNR, Roma
Pingue F, De Natale G, Martini M and Esposito T (1989) Deformazioni lente del suolo nell'area vesuviana nel periodo 1988-1989. Bollettino GNV for 1989, CNR, Roma
Vilardo G, De Natale G, Milano G and U. Coppa (1995) The seismicity of Mt. Vesuvius. Tectonophysics, submitted.
Copyright © Boris Behncke, "Italy's Volcanoes: The Cradle of Volcanology"